All posts by Per Magnusson

Oscillator Based Proximity Detector

I wanted to build a capacitive detector that can sense the proximity of a conductive object, like a finger or a piece of metal. I have some idea what I could use such a detector for, but the following prototyping exercise quickly diverged into a quick just-for-fun hack.

There are many ways to build capacitive detectors. A very common one is the variety of touch sensing solutions provided for micro controllers from companies like Atmel (QTouch), NXP, Cypress (CapSense), Microchip (mTouch) and others. In addition to these proprietary solutions, there are also some open source micro controller based solutions, some using ADC inputs and others using just plain digital I/O pins.

Another solution would be to build an oscillator whose frequency is dependent on the (small) capacitance that one is trying to sense. This seemed appealing to me as i felt like building some analog RF circuitry, so I decided to go down this route. Since the capacitance that is to be sensed is pretty small, on the order of a few pF, a relatively high oscillation frequency is required to have the change in capacitance correspond to a reasonably large change in oscillation frequency.

Again, there are many options on how to build an oscillator. I decided to use an incarnation of a Colpitts oscillator, namely the common collector type. The general schematics is shown below.

Basic schematics of a common collector Colpitts oscillator.

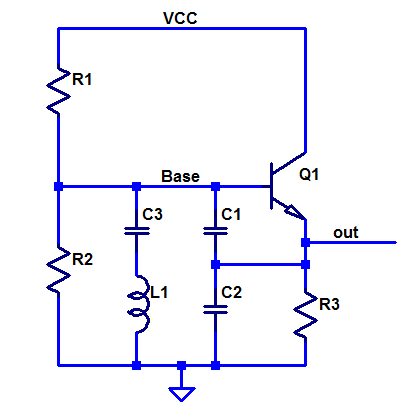
R1 and R2 (and R3) provide bias to the transistor. C1 and C2 provide feedback while L1 together with the series combination of C1 and C2 determine the oscillation frequency. C3 has a value large enough to act like a short at the oscillation frequency and prevents the inductor from ruining the biasing of the transistor.

After some quick simulations in LTspice, I ended up with the below circuit.

Colpitts oscillator with values.
Colpitts oscillator with component values.

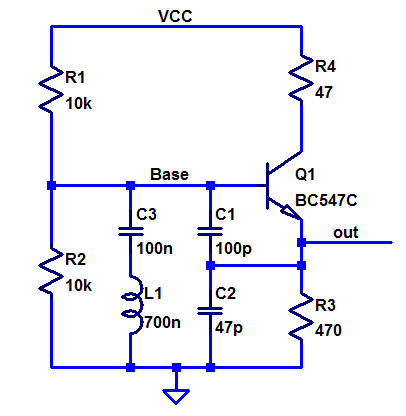
The addition of R4 helps to make the output more sinusoidal as it provides negative feedback at high frequencies via the miller capacitance between the collector and base of Q1. The oscillation frequency with the above component values is around 34 MHz.

So which node do we use as the sensing node? One could consider using either the output or the node labeled Base, but it is probably better to use the Base as adding capacitance there does not change the feedback ratio, while adding capacitance at the output would change the feedback and possibly risk stopping the oscillation. To use the Base as a sensor, it needs to be connected to a relatively large metal plate whose capacitance will then be modulated by nearby conductive objects.

Adding a pF at the Base will change the frequency by about 500 kHz. This is certainly easy to detect if one is using e.g. a counter input of a fast micro controller.

I decided however to make the change even easier to detect (especially by slower micro controllers) by mixing the output of the variable oscillator with the output of a fixed oscillator with a slightly lower frequency to produce a signal with a frequency that is the difference  between the two frequencies. The difference signal will thus see a much larger relative shift in frequency than the initial signal.

Building another identical oscillator (but without the capacitive sensing plate) is straightforward. This oscillator should however be trimmable so that it can be adjusted to have a frequency suitably below the frequency of the sensing oscillator. Typically one would do this with a trimming capacitor, but as I was building the circuits using parts from my junk bin and I had inductors with trimmable cores, I used one of those instead.

The main question that remains is how to build the mixer that shall essentially multiply the signals from the two oscillators to produce tones at the sum and difference frequencies of the original signals. There are of course many mixer circuits on the market and one can also build them using discrete components. I decided however to do it in a somewhat non-conventional manner, namely by using an XOR gate. The signals from the oscillators happen to have enough amplitude so that they can drive TTL (or CMOS) gates and I had a bunch of old 74LS86 quad XOR gates in 14-pin DIL packages. Ideally one would like to have gates with schmitt trigger inputs when driving them with analog signals. 74HC86 are XOR gates with such inputs, but since I did not have any of those laying around and did not feel like ordering any just for this quick hack, I went with the somewhat inferior (for this purpose) 74LS86.

What remains is to low-pass filter the output of the XOR gate to get rid of the high-frequency mixing products. I used a simple RC-filter for this, although an RLC-filter would have been more elegant and effective. To tidy up the signal and get a nice buffered square wave I used another of the XOR gates in the same package. Again it would have been nice to have a gate with a schmitt trigger input.

The complete circuit diagram is shown below.

Dual Colpitts oscillators with XOR mixer and low-pass filter

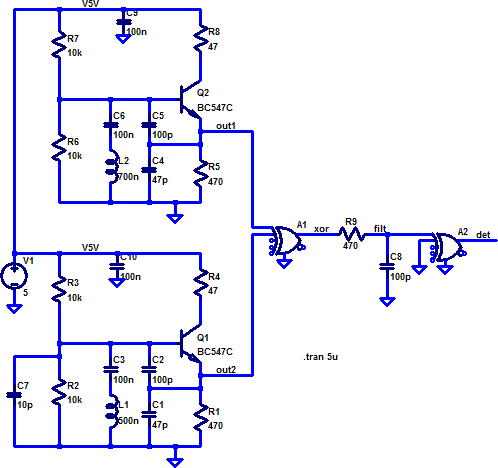
C7 is meant to represent the sensor plate. The decoupling capacitors C9 and C10 have no effect in the simulation but are good to have in reality as there is plenty of inductance in the wires from the power supply to the circuit.

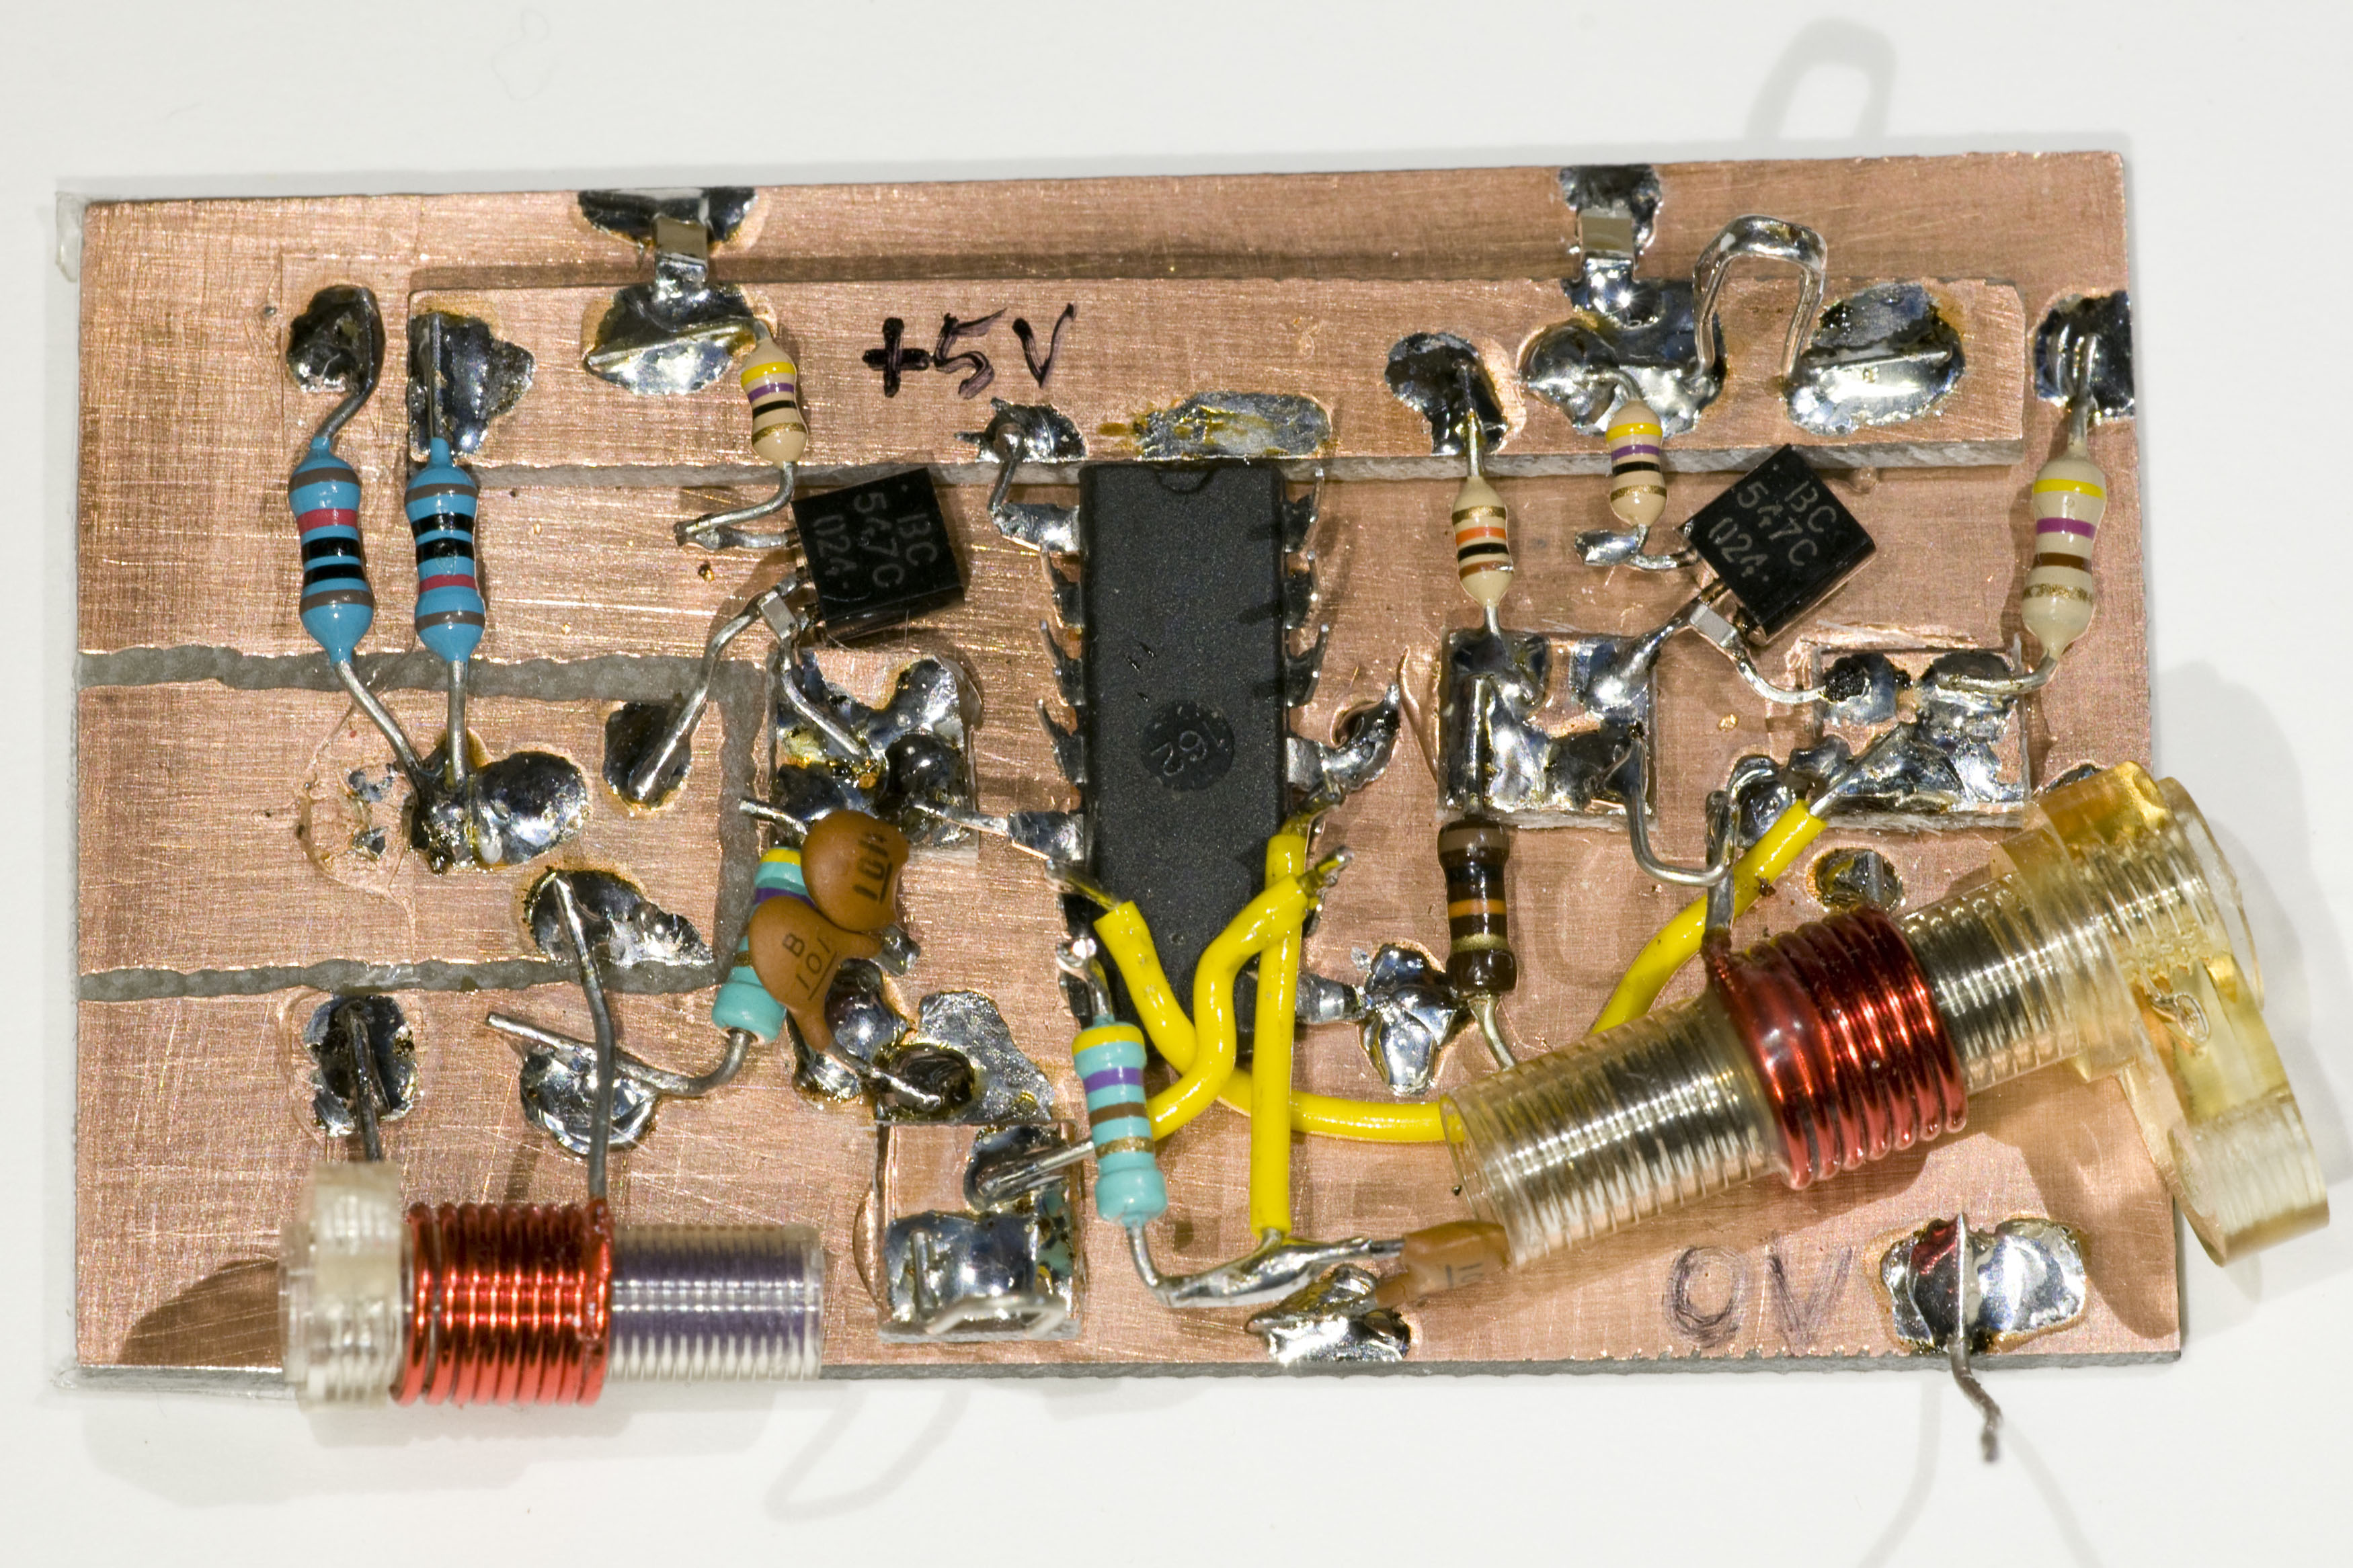
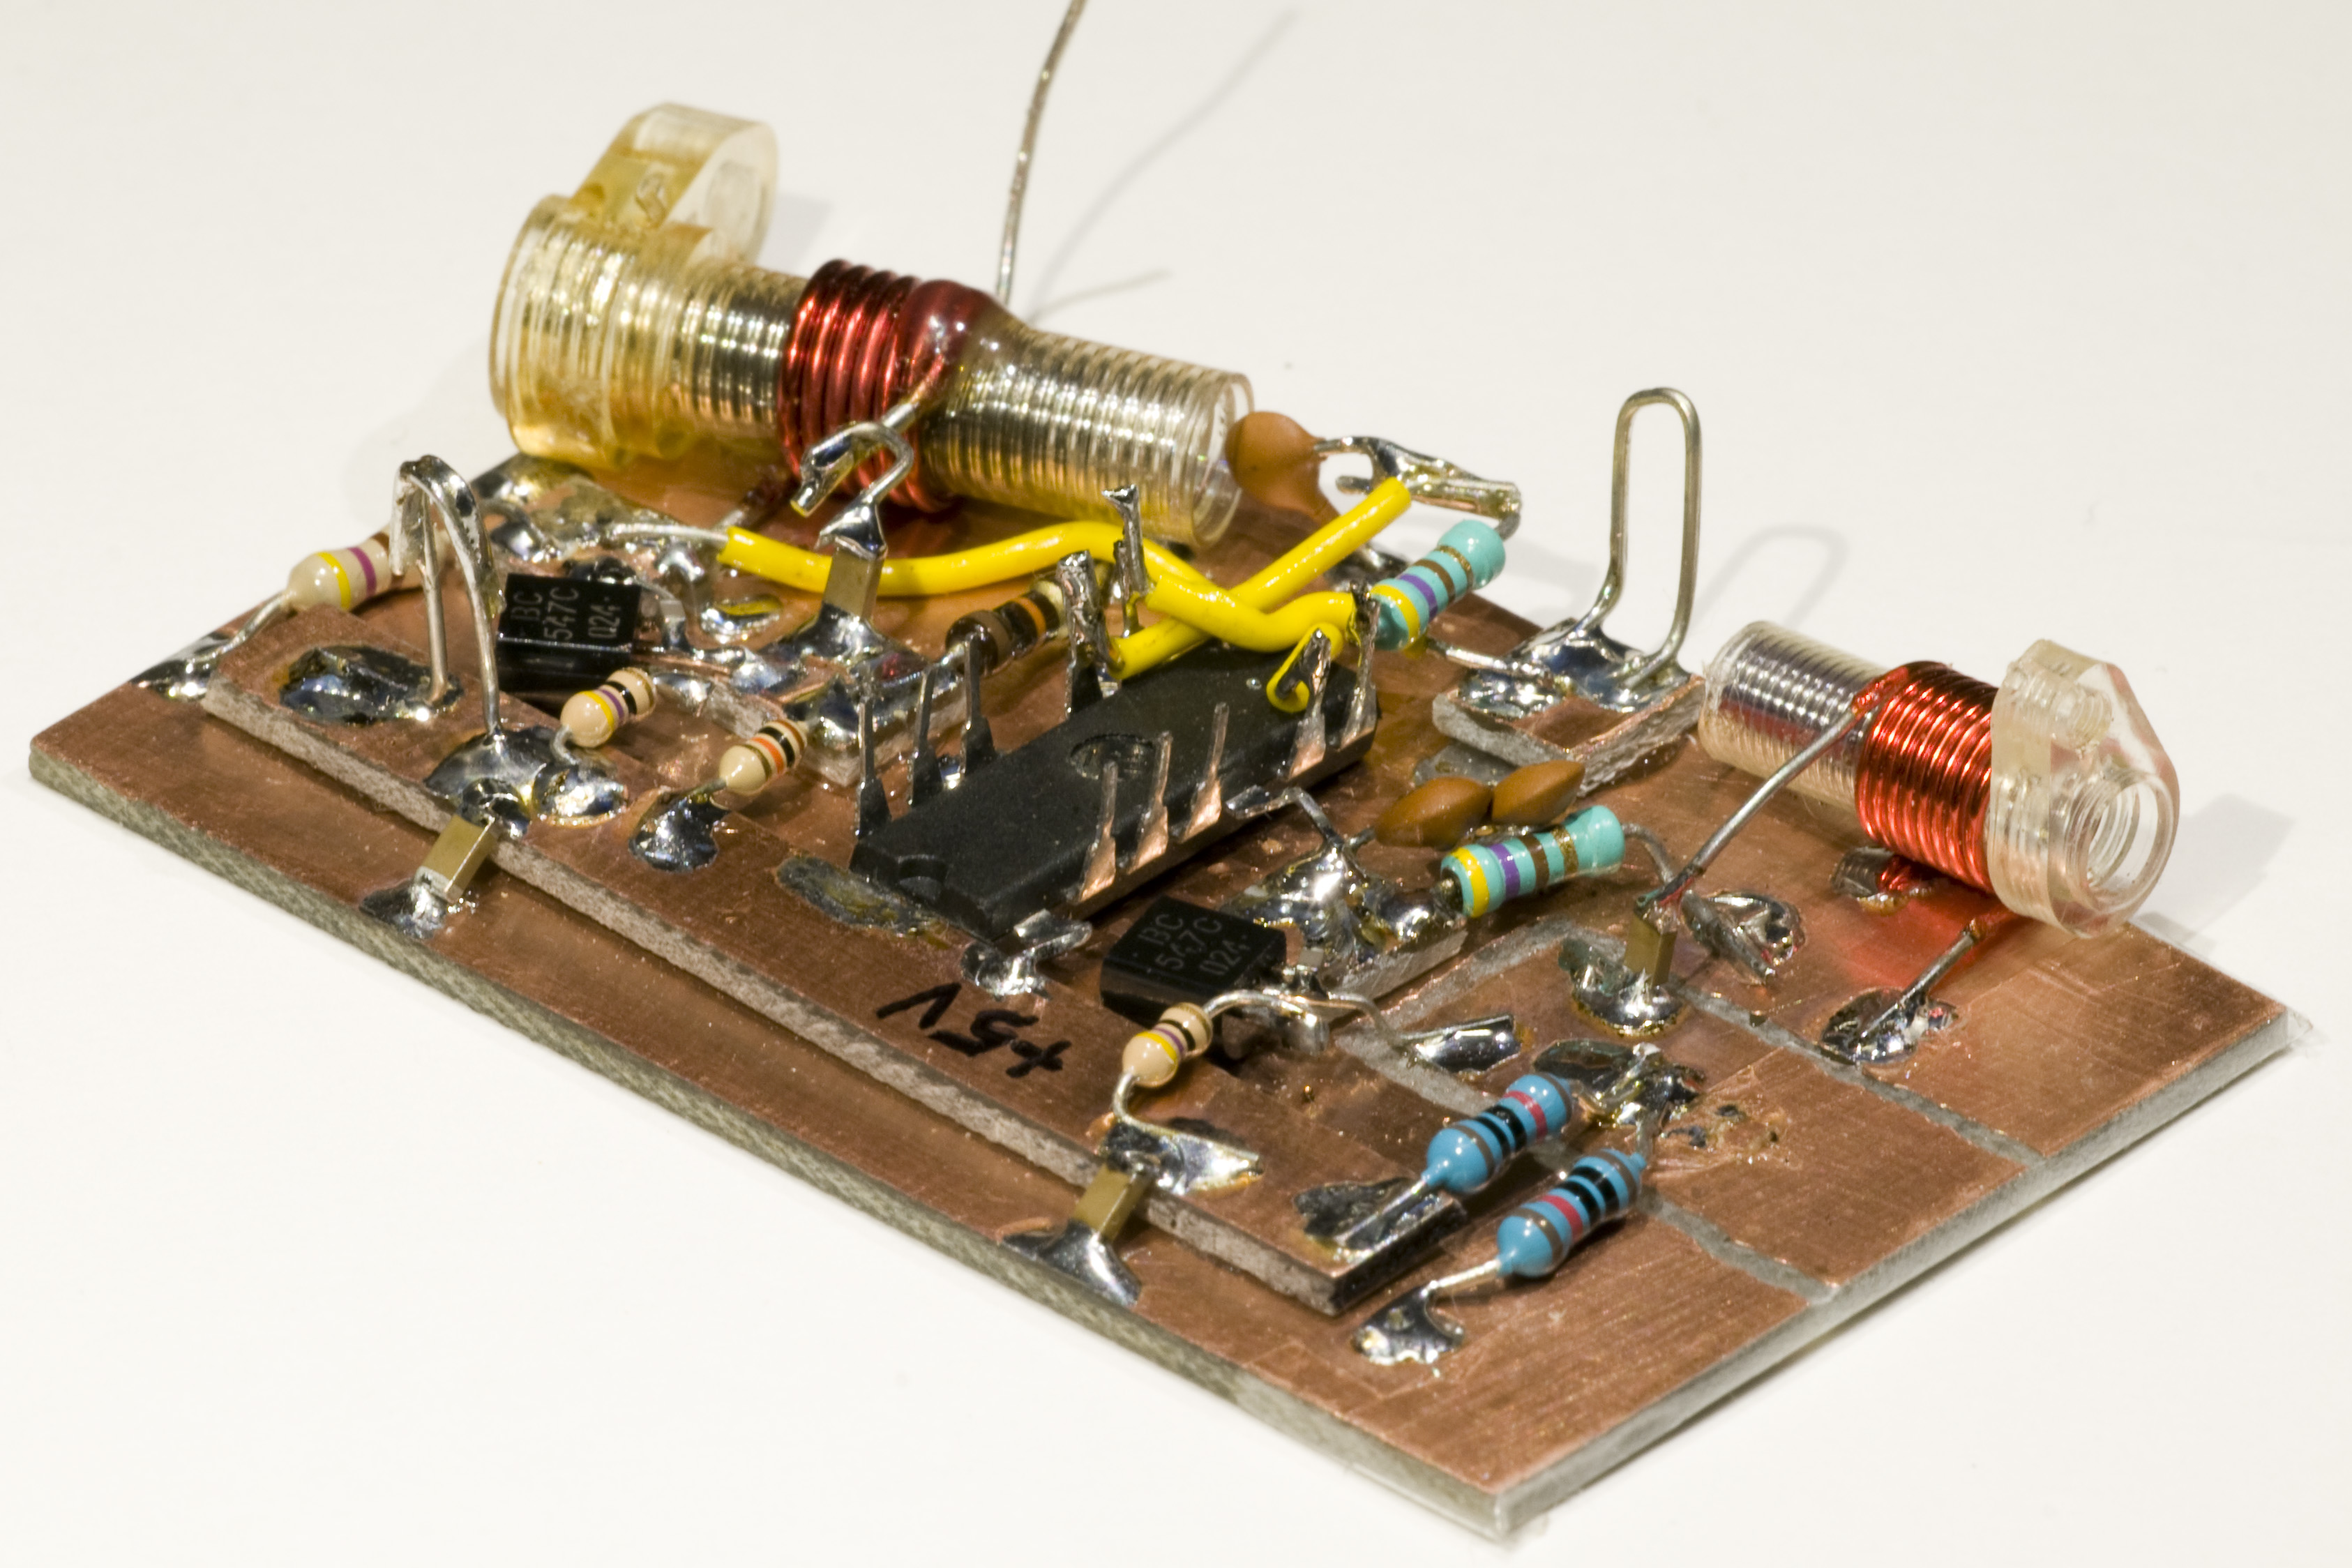
I built the whole thing on single-sided copper clad board as shown below.

The physical circuit built on copper clad board
Angled view of the board

Here is a labeled picture of the board:

Board with labels
Board with labels

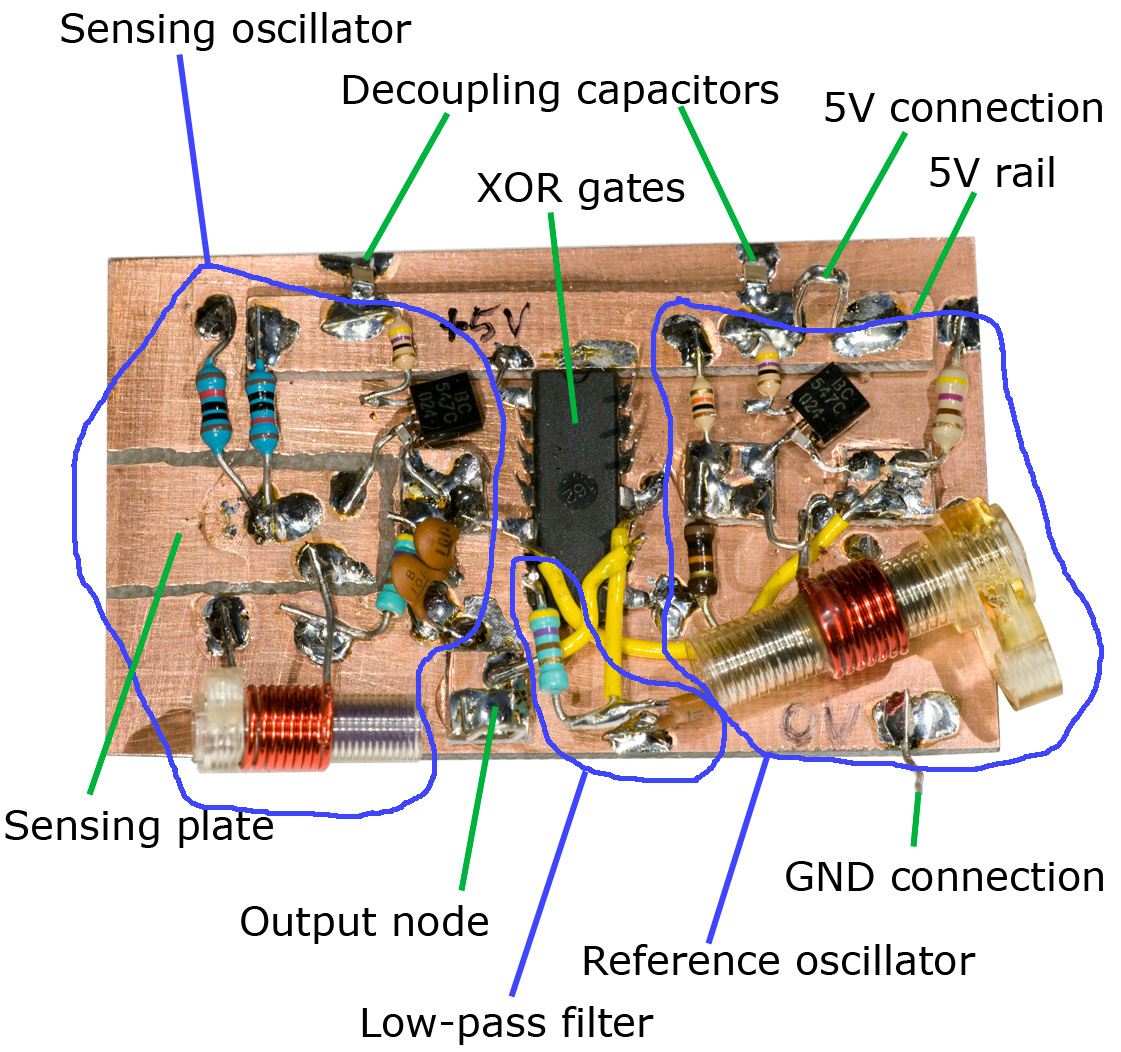
For the 5 V rail I used another slice of copper clad board on top (using hot glue) of the main board. Similarly, I glued small pieces of copper clad to serve as the base and emitter nodes of the transistors. For the sensing node, I milled out a slice of the main ground plane using a hand-held Dremel. The 74LS86 XOR gate package is placed upside down to provide easy access to the pins. The GND pin is bent down and soldered to the GND plane while the VCC pin is bent and soldered to the 5V rail. A drawing of the pinout when viewed from below is very useful when wiring up the XOR gates like this. I left unused XOR inputs floating, which is not exactly good practice, but generally works fine for 74LS chips. I would not have done that with a CMOS chip like 74HC86.

I used components I had on hand throughout, so there is a mix of old and new components. The inductors probably come from some radio or TV set that I disassembled 25 or more years ago. Some of the capacitors are surface mount and perhaps hard to see. The base-emitter capacitors are 0603 types soldered directly on the legs of the transistors.

So does it work?

Yes, it does. In fact I was surprised how little trouble I had getting the oscillators to oscillate and getting everything connected right. I started out by building the sense oscillator and it worked right away. When I later added the reference oscillator and the XOR gates they also worked without any issues. No troubleshooting opportunities this time.

Below are oscilloscope screenshots showing the signals at the output of the mixing XOR gate (CH1, yellow), at the output of the low-pass filter (CH2 blue) and at the output of the buffering XOR gate (CH3, green). The first plot shows the circuit free-running without any object close to the sensing plate and the second plot shows how the frequency is reduced when a metal object is close to the sensing plate.

Signals after mixing when no object is close to the sensing plate.
Signals after the mixer when no object is close to the sensing plate.
Signals after the mixer when a metal object is close to the sensing plate.

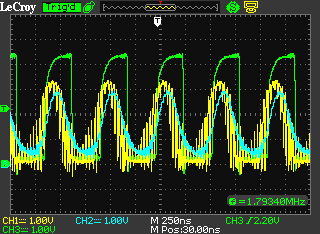
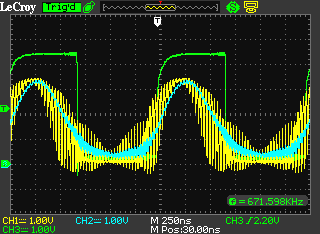
In the first case the mixed signal has a frequency of 1.79 MHz while it has been reduced to 671 kHz in the second case. The XOR gate is working at frequencies close to the limit of its abilities (and with input signals with poor slew rate at that), so it does not reach full swing (yellow trace), but it is still good enough for this purpose.

The Anatomy of a (Broken) Termination

A couple of weeks ago, I was using an ANNE-50+ 50-ohm SMA termination from Mini-Circuits, but noticed that it did not seem to work right. When I measured it using an ohm-meter, the resistance was around 100 ohms instead of the expected 50 ohms. I put the termination aside and I just got around to taking a better look at it since I was curious about how it was constructed inside. Below are two photos of what the termination looks like.

ANNE-50+ termination ANNE-50+ termination
ANNE-50+ termination

Before I started taking it apart, I remeasured the resistance. This time it was no longer 100 ohms, but rather an open circuit. So something had apparently happened inside it, although I am certain that it was not used while waiting for the autopsy.

Then it was time to start uncovering the secrets of the termination. I began by filing down the back side of it, which consists of a black plastic cap inside a brass tube.

Less than a mm below the surface, some more metal was revealed in the center of the device. This metal turned out to be electrically connected to the outer shell (ground).

A thin layer of the back side has been filed away.
A thin layer of the back side has been filed away, revealing some metal in the center.

Further filing next to the central metal piece allowed the plastic to be removed, revealing a 360 degree low-inductance metal connection between the center stud and the shell.

The back side plastic has been removed
The back side plastic piece has been removed.

Going a bit further allowed the central stud to fall out. It turned out to be a (cracked) resistor. It seems to be either a carbon film or metal film resistor on a ceramic core. The fact that it has somehow become cracked is of course the reason the device failed in the first place.

The central stud has come lose and turned out to be a cracked resistor.
The central stud has come lose and turned out to be a cracked film resistor.

A few final strokes with the file allows the remains of the pressed-in metal piece that connected the resistor to the connector shell to be easily removed. The center pin of the connector with its (teflon?) insulation and the other end of the broken resistor also easily falls out after this. The different pieces are shown in the photos below.

Pieces of the disassembled termination.
Side view of pieces of the disassembled termination.
Side view of the pieces of the disassembled termination.

One can see that the diameter of the hole in the shell of the termination is different in the section with the connector pin and the section with the resistor. The first diameter is dictated by the dimensions of the SMA connector and is almost certainly designed to give a 50-ohm impedance with the pin diameter and the dielectric used. The second diameter might be chosen to give the best possible return loss given the dimensions of the film resistor, but it might also be chosen primarily for mechanical convenience.

This termination is specified to have a return loss of better than 21 dB up to 18 GHz. I have heard that some other terminations which are not specified to perform well up to such high frequencies use standard SMD resistors inside, but performance to 18 GHz probably benefits from the coaxial design of this device.

So what might have caused the failure of the termination? I do not know for sure, but since the center pin is largely held in place by the apparently brittle body of the resistor, it seems like a strong force or torque on the center pin is the probable cause. This might have occurred because the termination was mated to a damaged SMA connector or for some other reason.

Visar statistik från Danmark att mobiltelefoner är farliga?

På Facebook har jag sett några vänner posta en länk till en artikel från 12:e juni 2014 på hemsidan hos (den lömskt namngivna) Strålskyddsstiftelsen (SSS). Rubriken är “Hjärntumörer ökar i Danmark. 55% fler på tio år”.

http://www.donotlink.com/cods

Om man inte läser så noga eller så värst kritiskt får man lätt intrycket att det här är kalla fakta som visar att det är jättefarligt med mobiltelefoner och att användningen av dessa är orsaken till ökningen i cancerfall. Läser man lite mer noga ser man att de hoppar raskt från påståendet om ökningen i antal cancerfall till ett helt orelaterat påstående om att SSS själva har gjort en sammanställning av forskning som visar att mobilanvändning ökar risken. De påstår också att ett markant trendbrott i cancerfallen skedde i Danmark 2003 som är utgångsåret för påståendet om 55% ökning på 10 år (till 2012). (Vi kan bortse från att de misslyckades lite i subtraktionen och att det bara handlar om 9 år från 2003 till 2012.)

Så, frågan är om det här stämmer.

Om det vore så att mobilanvändningen, som rimligen ökat och blivit väldigt vanlig från och med millennieskiftet ungefär, var orsaken till ökningen av cancerfall så borde man se samma ökning i länder med liknande mobilanvändning som Danmark. T.ex. i Sverige. I artikeln medger dock SSS att utvecklingen i Sverige är en helt annan, men de är lite otydliga på den punkten och anger inga procentsiffror för hur det hela har utvecklat sig i Sverige.

Jag lyckades dels leta upp statistiken från Danmark som SSS byggde sina påståenden på och dels motsvarande statistik från Sverige. Det verkar som om jag hittat samma statistisk som SSS, för jag kunde få fram samma siffror om Danmark som stod nämnda i artikeln.

Statistiken för Danmark hittar man här:

http://www.ssi.dk/Sundhedsdataogit/Sundhedsvaesenet%20i%20tal/Specifikke%20omraader/Kraeft/Nye%20krafttilfaelde%20-%20Regioner.aspx

Statistiken för Sverige finns här:

http://www.socialstyrelsen.se/statistik/statistikdatabas/cancer

Låt oss ta en titt på siffrorna. För Danmark fanns det statistik från 1978 till 2012 och jag har sammanställt den i nedanstående tabell och diagram där det framgår hur många nya fall av cancer i hjärnan eller centrala nervsystemet per 100 000 invånare som rapporterats under olika år.

År Antal fall/ 100 000 År Antal fall/ 100 000 År Antal fall/ 100 000 År Antal fall/ 100 000 År Antal fall/ 100 000
1978 14 1985 14 1992 15 1999 20 2006 23
1979 11 1986 15 1993 17 2000 21 2007 24
1980 13 1987 15 1994 17 2001 20 2008 27
1981 13 1988 15 1995 19 2002 21 2009 26
1982 12 1989 16 1996 19 2003 18 2010 29
1983 15 1990 16 1997 18 2004 24 2011 28
1984 14 1991 16 1998 22 2005 23 2012 28
Utvecklingen av antalet nyaupptäckta fall av tumörer i hjärnan eller centrala nervsystemet per 100 000 invånare per år i Danmark.
Utvecklingen av antalet nyupptäckta fall av tumörer i hjärnan eller centrala nervsystemet per 100 000 invånare per år i Danmark.

Notera gärna att år 2003 som SSS använde som utgångsår har en lägre siffra (18) än omgivande år (21 respektive 24), vilket ger en mer uppseendeväckande siffra, nämligen 55% ökning jämfört med 17% om man hade valt 2004 som utgångsår. En gissning är att det inte är en slump att SSS valde att utgå just från 2003.

Om det nu vore mobilanvändning som orsakade ökningen för den här sortens cancer så är det lite märkligt att ökningen ser ut att ha varit ganska stadig sedan åtminstone början av 80-talet då mobilanvändning var rätt ovanlig och då det definitivt inte fanns några mobiler där man höll antennen mot huvudet. Normalt tar det ju dessutom ganska många år från att man exponeras för en cancerrisk tills man utvecklar cancer, så man kan undra om SSS menar att mobilanvändningen på 60- och 70-talen är orsaken till början av den här kurvan. Eller var det kanske rullbandspelare och utsvängda jeans som ökade risken för hjärntumörer då?

Jag har ingen aning om vad som ligger bakom den här ökningen, men det finns verkligen inget som pekar ut just mobilanvändning. Kanske är det bara effektivare diagnosmetoder för tumörer eller bättre rapporteringssystem som ligger bakom?

Som sagt så borde utvecklingen av antalet hjärntumörer i Sverige ha varit likartad den i Danmark om orsaken till ökningen i Danmark är ökat mobilanvändande, vilket ju rimligen har varit ungefär densamma i de två länderna. Här är statistiken från socialstyrelsen över förekomsten av motsvarande nya cancerformer i Sverige under samma period:

År Antal fall/ 100 000 År Antal fall/ 100 000 År Antal fall/ 100 000 År Antal fall/ 100 000 År Antal fall/ 100 000
1978 13,4 1985 15,7 1992 15,165 1999 14,48 2006 15,5
1979 12,735 1986 15,775 1993 14,765 2000 13,905 2007 14,67
1980 13,175 1987 15,515 1994 14,745 2001 13,435 2008 14,7
1981 12,37 1988 15,29 1995 15,17 2002 14,26 2009 14,635
1982 14,06 1989 15,655 1996 14,02 2003 14,475 2010 15,97
1983 14,84 1990 15,405 1997 15,3 2004 14,085 2011 14,645
1984 16,25 1991 13,675 1998 15,39 2005 16,04 2012 13,505
Sverige
Statistik från Sverige över antalet nya fall av upptäckta tumörer i hjärnan eller centrala nervsystemet per 100 000 invånare per år.

Som synes har antalet fall per 100 000 invånare legat nästan still under perioden. Om man jämför 2003 med 2012 så som SSS behagade göra för Danmark så ser man till och med att antalet fall per 100 000 invånare råkar ha minskat med 7%! Så om SSS tyckte det var vettigt att dra en slutsats om mobilanvändningens påverkan på hjärncancer baserat på siffrorna från Danmark så är det lika vettigt att med utgångspunkt från de svenska siffrorna dra slutsatsen att mobilanvändning skyddar mot hjärncancer.

Vad den svaga ökning som ändå tycks finnas beror på vet jag såklart inte, men det skulle kanske kunna vara så enkelt att medellivslängden under perioden har ökat, vilket ökar chansen att en person ska utveckla en viss cancerform under sin livstid.

Sammanfattningsvis har Strålskyddsstiftelsen återigen bevisat sin oärlighet genom att på ett missvisande sätt plocka ut väl valda delar av ett statistiskt underlag ur sitt sammanhang för att försöka få det till att radiovågor från mobiler är livsfarliga. Det krävdes en del (men inte jättemycket) grävande för att få fram en mer rättvisande bild av vad statistiken egentligen säger, men de flesta som läser artikeln på Strålskyddsstiftelsens hemsida gör knappast det jobbet. Så om man läser och tror på det som står på Strålskyddsstiftelsens hemsida blir man vilseledd.

En risk med att tro att något användbart som t.ex. radiovågor från mobiltelefoner är farliga, trots att inget tyder på att de verkligen är farliga, är att man helt i onödan avstår från eller undviker något som skulle göra ens liv enklare eller bättre. En kanske värre risk är att man skyller något medicinskt problem på fel orsaker och på så sätt missar chansen att hitta och lösa det verkliga problemet, till stora kostnader (både bildligen och bokstavligen) för en själv och sin omgivning.

2013 fick Strålskyddsstiftelsen föreningen Vetenskap och Folkbildnings förvillarpris. Det var välförtjänt.