A friend of a friend is apparently about to build a system where he uses the DC supply wires between boards also for some kind of communication. To do this, he intends to put inductors in series with the supply lines so that the powered circuitry does not load the signals.
I got hold of two inductors that are candidates to be used for this purpose and decided to measure them using my VNWA and the simple test fixture. By lowering the audio (IF) sampling rate of the VNWA, it is possible to measure down to 1 kHz and below, which is of interest for these kinds of large-value inductors. I set the sampling frequency to 900 Hz, the measurement time per data point to 100 ms and the frequency range to 1 kHz to 10 MHz. I used the S11 measurement so that I could use the built-in inductance plotting feature.
The first inductor is marked (color coded) 1000 µH. It has a DC resistance of 5.7 ohms measured using an ohm meter. Below is a plot of some curves for this component.
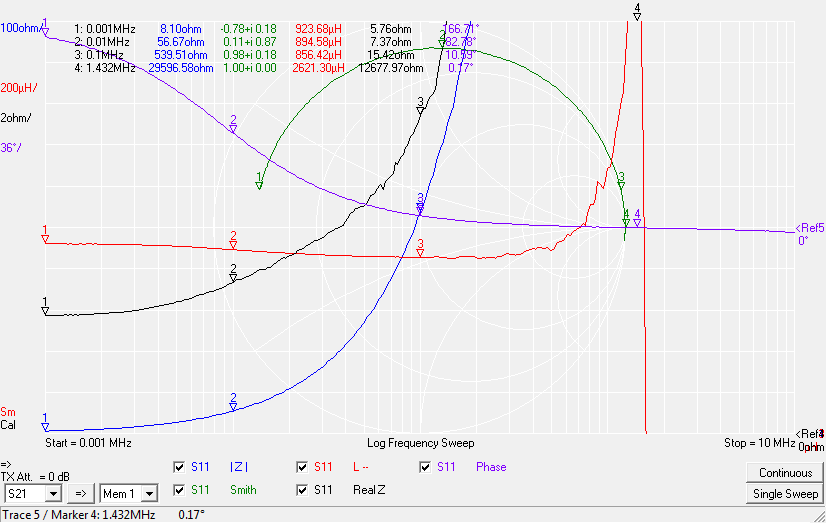
The impedance (blue curve) goes up from low frequencies (as expected) and reaches 1000 ohms at about 200 kHz. It then stays above 1 kohm at least up to 10 MHz.
The inductance varies a little with frequency between 850 µH and 930 µH for frequencies between 1 kHz and 500 kHz.
The inductor is (parallel resonant) at around 1.4 MHz where it has a maximum impedance of nearly 30 kohms (a very uncertain value due to the S11 method’s inappropriateness of measuring impedances that are much larger or smaller than 50 ohms, the series S21-method should be used instead to get a more precise number).
The ESR (equivalent series resistance) is plotted in black. It goes up from 8.1 ohms at 1 kHz (remember it was 5.7 ohms at DC). This increase with frequency might be due both to skin effect and losses in the core.
This inductor has an impedance of above 500 ohms for frequencies between 100 kHz and at least 10 MHz, so if the communication is done in this frequency range, the loading through the inductor should be pretty low.
One caveat is that the inductance (and impedance) might go down when DC current is run through the inductor. This, as well as the simple IR drop across it is something to look out for in the application.
It might be possible to add a DC-blocks and a current source (that has to have high impedance over the frequency range of interest) to the test fixture to test the effect of a DC bias.
The second inductor is marked 10 mH and its curves are shown below. Note that some of the scales have been changed by a factor of 10. At DC, this inductor has a resistance of 60 ohms.
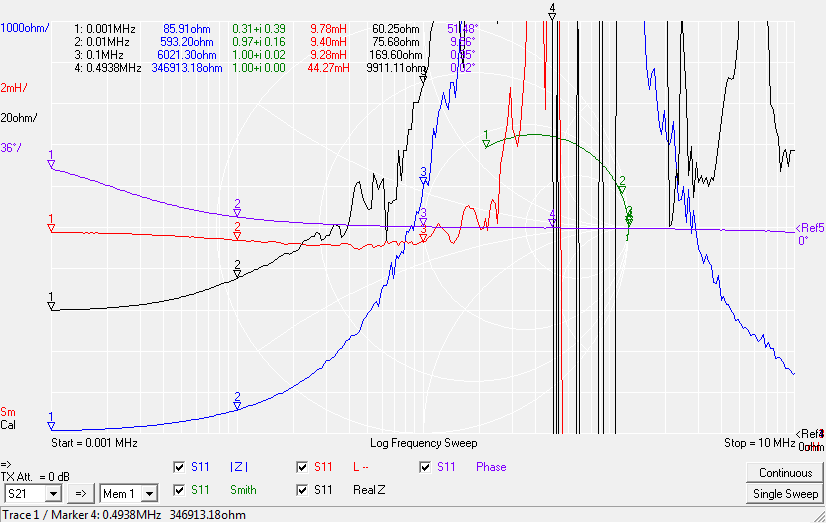
This inductor might be suitable if very little current will be pulled through it (due to IR drop and saturation of the core), but it does of course provide higher impedance for lower frequencies. Above resonance, which happens around 500 kHz, the impedance comes back down again, so that it is 5 kohms around 3 MHz and 1.5 kohms at 10 MHz.